| |
||
| |
||
 |
||
| |
|
|
|
|
Sound is a longitudinal wave, which means that the vibration of the air is in the direction of travel of the sound wave.

Sound is invisible, so we have to animate to see it. (For film clips of visible examples, see Travelling Waves). In the animation below, the top graph shows a sine wave y(x'), where x' is a coordinate moving with the wave. On the axis below, we turn this into a longitudinal wave by rotating the arrows clockwise, so positive displacement is now to the right and negative to the left. We then apply these displacements to the 'particles'. This gives regions of high density (particles close together) and low density, which is plotted on the next axis. In the final graph, the density is represented in colour, to give an exaggerated picture of a sound wave at a moment in time.
This animation is one of several from Sound, pressure and density. See also this multimedia introduction to sound.
| Resonance refers to the capacity of some systems to store energy in vibrations at a particular frequency. The picture at right is a Chladni pattern of one of the resonances of a violin back. The resonances of the violin body are vital to the operation and timbre of the instrument.
Oscillations and resonance are a huge topic in physics, engineering and music acoustics. Here are an Introduction to resonance and a multimedia introduction to oscillations. |
|
More explanations, sound files and film clips are given on Quantifying Sound and Sound Frequency and Pitch. A table of frequencies, note names and MIDI numbers is given below. Conversion in either direction is available from this site.
Before leaving this section, it is worth noting that frequency and pitch can only be determined precisely for sustained, steady tones. Musicians know that they must be more careful with the tuning of long notes and chords than the notes in rapid passages. This effect is a fundamental property of waves, which is explained using sound files in The Musician's Uncertainty Principle. (That page also relates it to Heisenberg's Uncertainty Principle.)
In this recording (fromWhat is a decibel? ), the first sample of sound is white noise (a mix of all audible frequencies, just as white light is a mix of all visible frequencies). The second sample is the same signal, but with the voltage reduced by a factor of the square root of 2. The reciprocal of the square root of 2 is approximately 0.7, so -3 dB corresponds to reducing the voltage or the pressure to 70% of its original value. The green line shows the voltage as a function of time. The red line shows a continuous exponential decay with time. Note that the voltage falls by 50% for every second sample. What is a decibel? relates sound intensity and pressure and frequency to phons, sones, loudness and the frequency response of the ear. You can also measure your own hearing response using this Hearing Test on-line. |

![]()
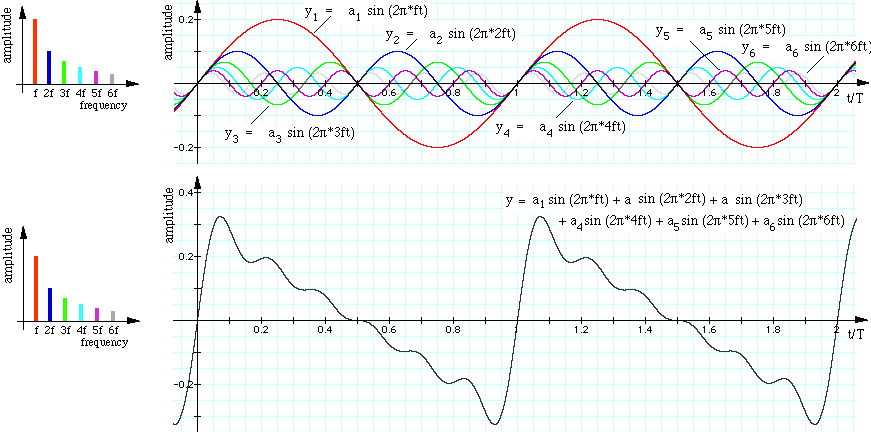
![]() The first six harmonics of a sawtooth wave, sounded one at a time.
The first six harmonics of a sawtooth wave, sounded one at a time.
These examples are among those given on What is a sound spectrum? and on Spectrum, harmonics and timbre.
Timbre depends somewhat on spectrum. But it depends very strongly on how a note varies in time. For a demonstration, see Timbre and envelope. See also the multimedia presentation on Quantifying Sound.
The sound file will convince you that, with this just intonation, F double sharp is not the same note as G. Alternatively, if you said (quite reasonably) that there is no key of D# major, then we could have used E flat, F and G as the final third, and proved that E flat and D# are not the same note in just tuning.
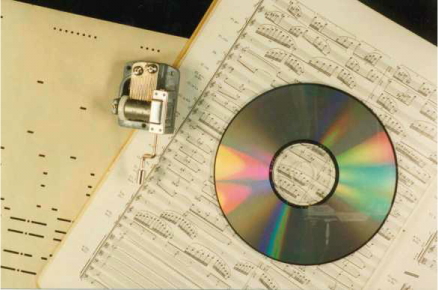
Tartini tones and temperament: an introduction for musicians is an easy introduction. For more detailed explanation and examples, see Tartini tones and temperament, and the multimedia presentation Interference and consonance.Music notation is a digital signal, in that pitches have specific values and notes have specific lengths. In note processors such as Sibelius, both are stored as numbers. This coding is extremely efficient: a written score contains much less information than the recording of a performance. This photo, from a paper by the author about information creation and storage in music, shows four digital storage media: a pianola roll, a music box drum, the score of Stravinsky's Le Sacré du Printemps and a compact disc.

The next two animations (from Open vs closed pipes) show standing waves caused by reflections at the ends of two different pipe configurations that are used as very simple approximations of a flute (open at both ends) or clarinet (open at one end).
But there is very much more to musical instruments than these very simple models would suggest. For an introduction, try our web site: Music Acoustics and its pages introducing different families of instruments.
DC-AC conversion
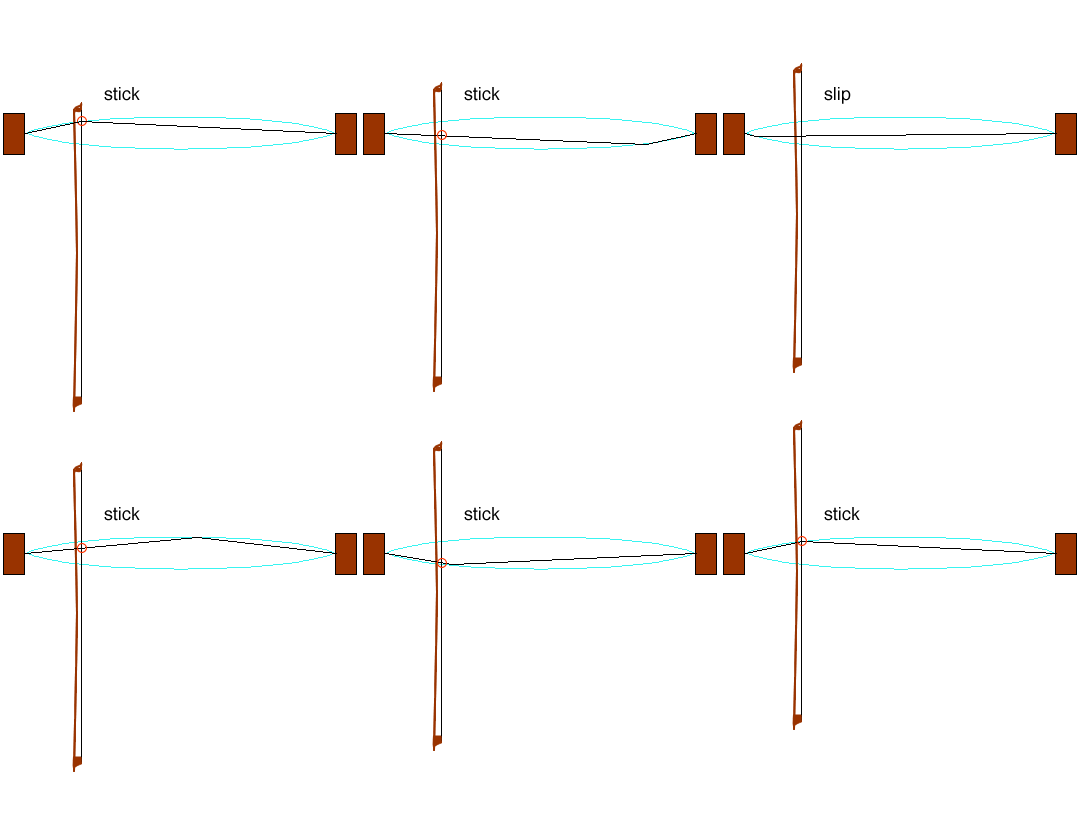
Bowed strings, wind instruments and the voice can produce steady sustained tones, because they can convert a steady ('DC') supply of energy from the arms or breath into that of oscillatory ('AC') motion. This observation is of fundamental importance in music acoustics because it gives rise to harmonic spectra and thus to harmony. Nearly harmonic spectra can be produced by plucked and struck strings, but this is, comparatively, a very recent invention. The animation at right shows how a bow, travelling with a steady speed (DC), excites a vibration (AC) in a string. (From Bows and strings.) The lateral force between bow and string is related to their relative speed and other variables by equations that are nonlinear: the force is not proportional to the speed (or position). Similarly, the relations between the vibration of a brass player's lips, a woodwind reed, a flute's air jet or a singer's vocal folds and the air flow past or through them are nonlinear (meaning that the change in air flow is not proportional to the change in the other variable). Without going into mathematical details, we note that this nonlinearity has the effect of producing periodic vibration with high harmonics, and the presence of harmonics has the important musical consequences noted above. The graph below is a schematic of air flow vs time past a vibrating reed for successively higher dynamic levels. Vibration up and down the bold line converts DC flow into AC flow in reed instruments. More details at Introduction to clarinet acoustics. |
String instruments use highly uniform strings that, usually, a very flexible. A consequence is standing wave resonances that fall very close to the harmonic series.
These graphics and sound files come from Strings, standing waves and harmonics. See also Bows and strings and Violin acoustics and Guitar acoustics for an introduction to those families.
For an introduction to woodwind and brass, see the various different instrument families on Music Acoustics.
A vibrating string on its own tends to slip through the air without transmitting much power: that's what the bodies of violin, guitar etc are for. Technically, this is called impedance matching. Standing sound waves in a narrow pipe also don't radiate well: that's what the bells of brass instruments and some woodwinds are for. Listen to the differences between these 'instruments'.
See Bells for more information.
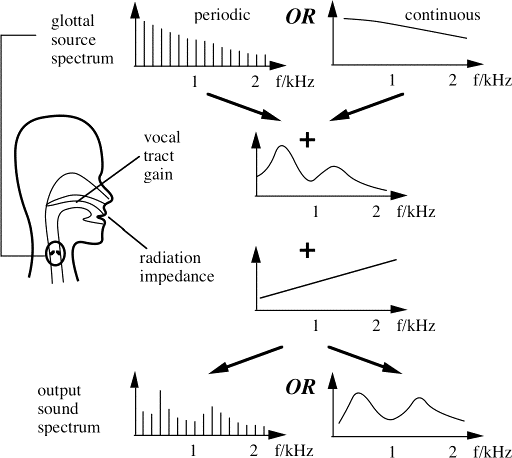
The vocal folds in the larynx vibrate a little like a trumpet player's lips. The big difference, however, is that the pitch of the brass instrument is controlled by the instrument, whereas the singer's vocal tract never determines the pitch in normal playing. Rather, the tract resonances preferentially 'boost' some bands of frequencies, called formants, in the output sound.

A schematic of the source-filter model, from Wolfe et al (2009). The periodic spectrum at left corresponds to normal speech and singing. See also practical examples of the source-filter model, with measurements and sound files.
For a multimedia introduction to the voice, see Human sound and more technical details in An introduction to voice acoustics.
© 2011, JoeWolfe
|
|
|
|