Impedance heads and acoustic impedance spectrum measurements
 Acoustic impedance heads measure the acoustic impedance spectrum Z, the ratio of acoustic pressure p to acoustic volume flow U. Here we describe techniques developed in this laboratory that allow measurements over nine octaves with a single impedance head. Briefly,
• three microphones are needed to give a wide frequency range,
• three non-resonant loads are used for calibration and
• the excitation spectrum is optimised to compensate for the impedance spectrum being measured, the acoustical reseponse of the head itself, and the noise present.
For introductions to acoustic impedance and specific acoustic impedance, see Sound: impedance, power and intensity. For some applications, see What is acoustic impedance? For reviews of techniques for measuring acoustic impedance, see Dickens et al (2007).

The apparatus
This schematic shows the apparatus. The computer generates a sum of several hundreds or thousands of sine waves whose relative phases are chosen to improve signal to noise ratio. Via the DAC and a power amp, these drive a loudspeaker matched via a horn to an acoustic waveguide leading to the plane at which the impedance spectrum is to be measured. Three microphones are positioned along the duct. One of the spacings is relatively small: the upper frequency limit is imposed when this separation is one quarter wavelength. The other spacings are long to improve the sensitivity at low frequencies.
This allows the nine octave range.
If the duct in which the microphones are mounted were pefectly cylindrical and if the microphone gain spectra and geometry were exactly the same, that would simplify measurements. (For rough measurements, these approximations may be made). For precise measurements, the microphone gain spectra and geometry must be calibrated. |

Calibration
We use three non-resonant loads for calibration.
The most important of these are very long ducts, which behave approximately as infinite waveguides. These are long cylindrical pipes located in the ceiling space of our building. One has length 42 metres, limited by the width of the building, the others are rather longer and have gentle curves after the first 35 metres. In principle, there are echos from the remote however, for narrow pipes, the visco-thermal losses at the walls reduce the magnitude of the echo by ~ 80 dB. For low frequencies and large diameter pipes, one can calibrate before the echo returns: a pipe of >170 m length really is acoustically infinite for the first second.
A nearly infinite impedance (open circuit) also has no resonances. This is made with a heavy block attached at the reference plane. A large baffle also has no resonances, and, provided it is much larger than the diameter of the head, its geometry has little effect. Finally, the magnitude and phase of components of the excitation spectrum are optimised to compensate for the impedance spectrum being measured, the acoustical reseponse of the head itself, and the noise present.
For more details on the techniques and calibration, see Dickens et al (2007).
 Some results
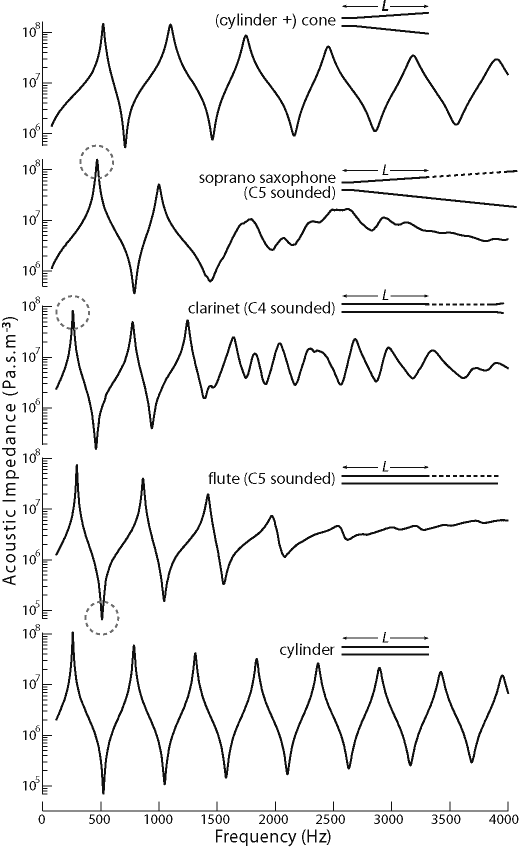
Several impedance spectra are shown at right (magnitudes and phases are measured, of course, but only the amplitudes are shown here).
These five systems have (at low frequency) the same 'effective length'. The first is a conical duct with a small cylindrical section at the input. The second is a soprano saxophone (approximately conical), with some tone holes open so that it plays the note C5. Then a clarinet (roughly cylindrical) with the tone holes opened to play C4, a flute (roughly cylindrical) with the tone holes opened to play C5, and finally a simple cylindrical pipe. (These examples are explained and contrasted in What is acoustic impedance?)
Because the gains of the loudspeaker and microphones are poor at low frequency, we have not made measurements below 10 Hz. Our upper limits (determined by the microphone spacings) are either 4 kHz or 8 kHz.
Compromises must usually be made on the different aspects of performance. The combination of a large frequency range and high frequency resolution demands that the available energy be distributed over very many different frequencies, and this reduces the signal:noise ratio available and thus the dynamic range. If one is only interested in impedance peaks (and especially if one plots the impedance on a linear scale), then low signal:noise ratios may be acceptable.
References.
- More details of this technique, and a review of other techniques for measuring acoustic impedance are given by Dickens et al (2007).
- For a portable infinite waveguide, see Dickens et al (2010).
- Our first report of using very long waveguides for calibration and for adapting the excitation spectrum to compensate for the gain in the system is Wolfe et al (2001).
- This paper analyses corrections for mismatches between the impedance head and the load: Fletcher et al (2005).
Introductory reading.
|
|

